
Executive Insights
Underbuilt and Under Pressure: What Today’s Supply Gap Means for Multifamily Investors

If you want to understand where the next wave of real estate opportunity lies, stop staring at the Fed. Start looking at housing supply.
Since the 1970s, the U.S. housing supply has struggled to keep pace with demand, a dynamic even more pronounced after the Great Recession. As of today, the market still hasn’t fully recovered from that downturn. The U.S. housing market is quietly undergoing one of its most consequential slowdowns in new supply in over a decade. That matters—not just for developers, but for every investor trying to understand what pricing, performance, and opportunity might look like over the next five years.
Let’s look at the numbers. Housing starts fell to their lowest levels since 2017 by the end of 2024. Construction timelines have stretched from 18 months to over two years, especially for mid- and high-rise projects. Financing has tightened, interest rates are hovering around 6%, and apartment loan origination dropped by 50% from 2022 to 2023.
Supply is throttled, and there’s no sign of that easing in the near term.
At the same time, demand remains resilient. The affordability gap in housing has widened. Only 20% of renters could afford to buy in 2024—down from 50% in 2019. More households are opting to rent by necessity or by choice, and they’re staying put. Renters today aren’t just younger households—though Millennials and Gen Z remain a strong force—they’re also more affluent, flexible, and urban-focused. In more than two-thirds of large U.S. metros, high-income renters are commanding a growing share of inventory.
Add to this the longer-term demographic headwinds—declining birth rates, an aging population, and sluggish household formation—and the setup becomes clear. This isn’t just a cyclical dip in development. It’s a structural shortage with serious investment implications, particularly for the pricing power of rental properties.
Immigration also plays a vital role in these market dynamics but poses challenges in terms of predictability. Baseline forecasts assume 870,000 immigrants annually through 2035—supporting roughly 1.1 million housing units a year. But a lower-immigration scenario (say, 422,000 per year) would slash expected demand by almost half. That’s not just a population challenge—it’s a labor issue, a construction pipeline issue, and a growth constraint for key metro areas.
With this in mind, investors need to think more like operators – focusing not just where people are moving, but where they can actually live long-term, and where housing can be built, financed, and completed. Regions where policy supports new construction are poised for the strongest long-term returns. As population dynamics, initially reshaped by COVID-era mass migrations, begin to stabilize with the return-to-office mandates, investment opportunities are shifting accordingly.
Regional Cap Rate Comparison (2024)
Cap rates vary dramatically by region, with higher yields seen in Sun Belt states compared to more supply-constrained areas.
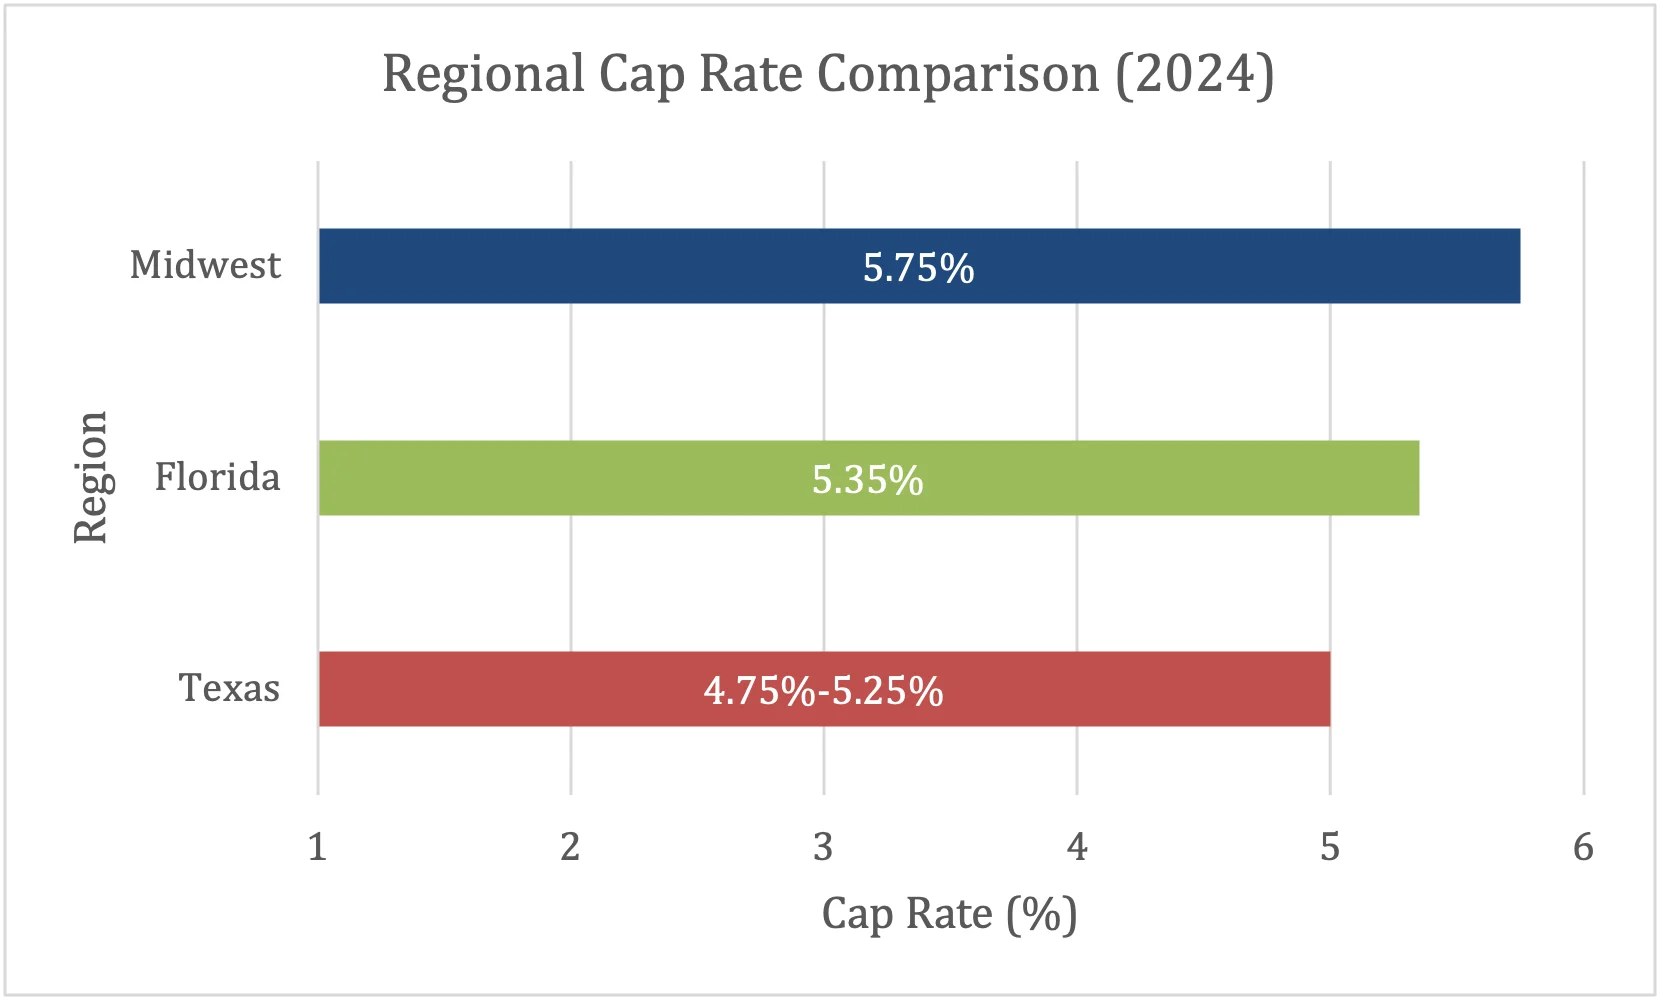 Source: HZ Analysis of Market Data, 2024
A few markets are already revealing the blueprint.
Kansas City continues to exhibit strong multifamily fundamentals, supported by a resilient economy, steady in-migration, and a highly manageable development pipeline.
The modest new supply—less than 3% of existing inventory is expected to be delivered over the next two years—has aligned well with robust demand. As a result, rent growth through Q1 2025 reached a nation-leading 3.9%. The market’s combination of rent growth and high occupancy—driven by a flourishing, diversified economy—earned it the #3 ranking among multifamily real estate markets by Walker & Dunlop.
Nashville is another standout. Despite delivering more than 12,000 new units in 2024, vacancy rates remained steady around 8–8.5%. That stability reflects job growth, not just construction pace. The city has benefited from corporate investment—Oracle, TikTok, and Sony have all expanded in the region—fueling demand even as new supply hits the market.
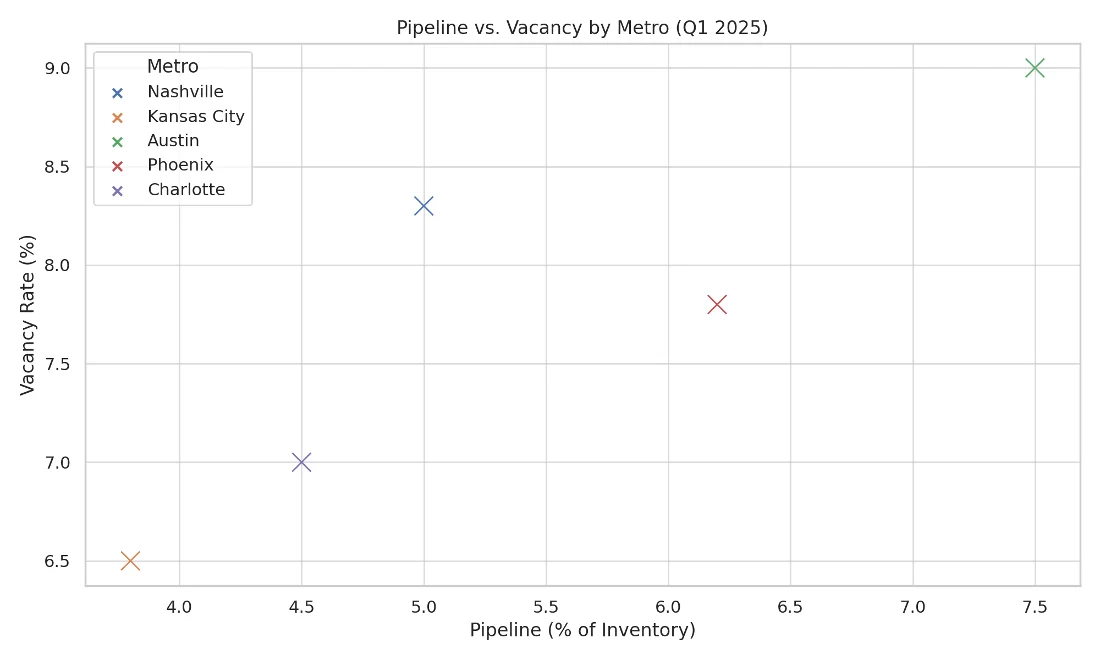
Pipeline vs. Vacancy by Metro (Q1 2025)
Smaller towns are increasingly benefiting from tech and corporate relocations, while high-pipeline cities like Austin and Phoenix are under pressure to absorb units. In contrast, cities like Kansas City and Charlotte present a more favorable balance.
Kansas City is seeing strong momentum, driven by medical sector expansion and a surge in data center development—highlighted by Google’s 2024 announcement of a $1 billion investment in the area. Meanwhile, Charlotte stands out for its economic resilience, anchored by major employers such as Microsoft and Bank of America, along with strong contributions from the health care and education sectors.
 Source: CoStar, RealPage, HZ Housing Outlook
Texas and Florida continue to anchor national trends, though the conversation there has shifted. These states remain magnets for population growth and inbound capital, but the pace of building has slowed. Zoning-friendly policies help, but high construction costs and tighter financing have made it harder to pencil out deals—even in markets with strong demographic tailwinds.
Here’s the takeaway: market divergence is accelerating. The old real estate adage—”location, location, location”—still holds, but now it’s married to “zoning, supply, and local labor dynamics.” Regulatory hurdles can eat up to 40% of construction costs in urban metros. Some cities, like Minneapolis and Salt Lake City, are responding with smart policy shifts—relaxing parking minimums and height restrictions to encourage development. Others are stuck in legal limbo or resisting reform entirely.
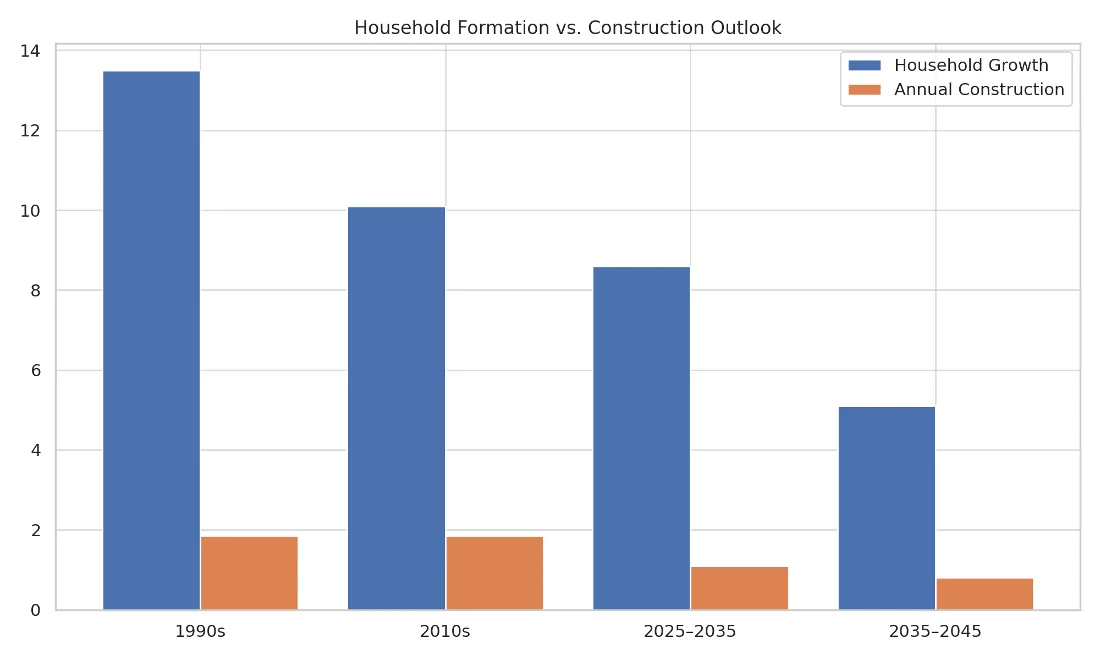
Household Formation vs. Construction Outlook
Projections through 2045 show a slowing rate of household formation paired with reduced annual construction levels. Long-term underbuilding may become entrenched.
 Source: U.S. Census, HZ Forecast
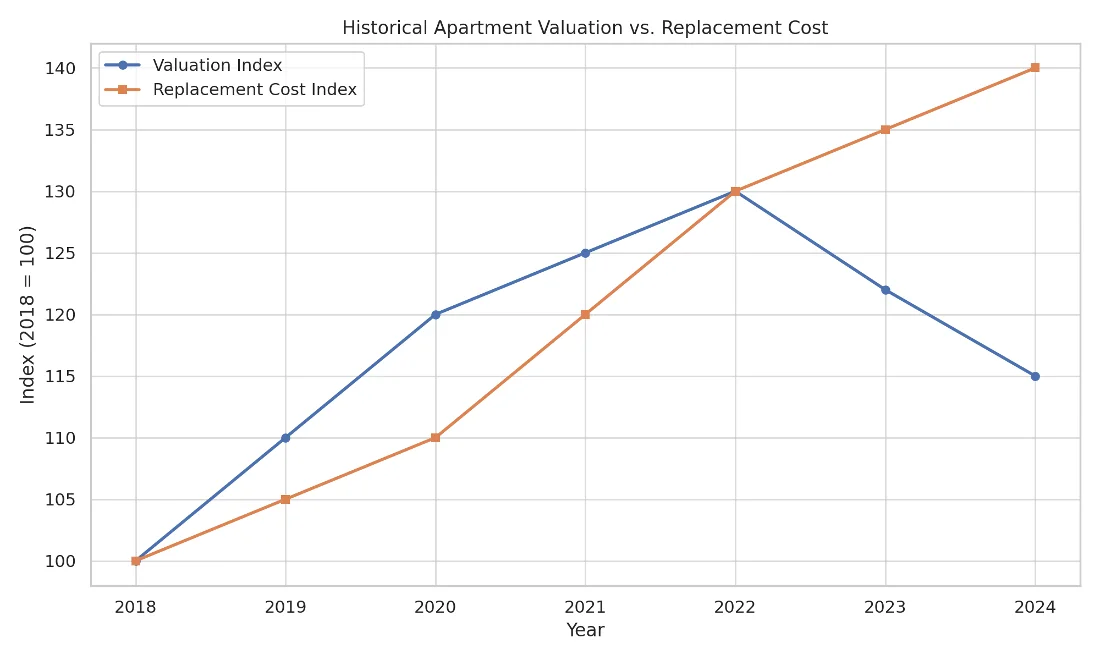
We’re also entering a phase where construction costs are outpacing valuation. In many cases, new projects are being valued below replacement cost. That’s led to a sharp drop in apartment valuations—10–15% off 2022 peaks—and stalled projects mid-build. For investors, that creates a window to acquire quality assets at a discount while new supply remains constrained.
Historical Apartment Valuation vs. Replacement Cost
Since 2022, apartment valuations have declined while replacement costs have continued to rise—creating a widening gap and making acquisitions more attractive than development in many markets.
 Source: Internal HZ estimates based on Real Capital Analytics, 2018–2025
In this kind of environment, the fundamentals matter more than ever: Net Operating Income (NOI), cap rate spreads, rent growth versus cost burden. But so does local context. Housing is becoming hyper-local, and successful investors will need to understand not just the national backdrop, but the street-by-street forces shaping opportunity.
This isn’t a time to sit on the sidelines. It’s a time to get smart about where supply is broken, where demand is sticky, and where the conditions exist to bridge the gap.


With stubborn inflation, investment triggers feel harder to pull in 2022. Multifamily real estate is a strong option.
ReadA $100 billion wealth migration tilts US economy’s center of gravity south.
Read
Featured in Wealth Management's 2024 Market Outlook, HZ President and Chief Investment Officer David Nelson explains why investing in multifamily properties can still be a powerful vehicle for building wealth.
Read